

Eleven questions to get you started and check your maturity in a newsroom data cleanup mission.
Most newsrooms have a daily metrics habit: pageviews, top stories, bounce rate.
The routine we present in this checklist replaces that habit with eleven questions whose answers tend to change what gets published or promoted next.
The assumption is that the newsroom is trying to build a returning audience and convert that audience into direct relationships (registrations, newsletters, subscriptions).
Each item in the routine shows the question, the time to ask it, and one line on why it matters.
How is the checklist structured?
The routine is broken down into daily, weekly, and monthly checkups. Below is one example from each section. You can get the whole list for free; just fill in this form for us.
Daily (5 minutes)
Which story published in the last 24 hours converted unknown readers into known ones through newsletter sign-up, registration, or paid subscription?
Why: known readers are what newsletter strategy, subscription growth, and reader retention all build on. The story that drove acquisitions today is the clearest signal of what your audience commits to.
…
Weekly (20 minutes)
Which traffic sources delivered visitors who came back this week?
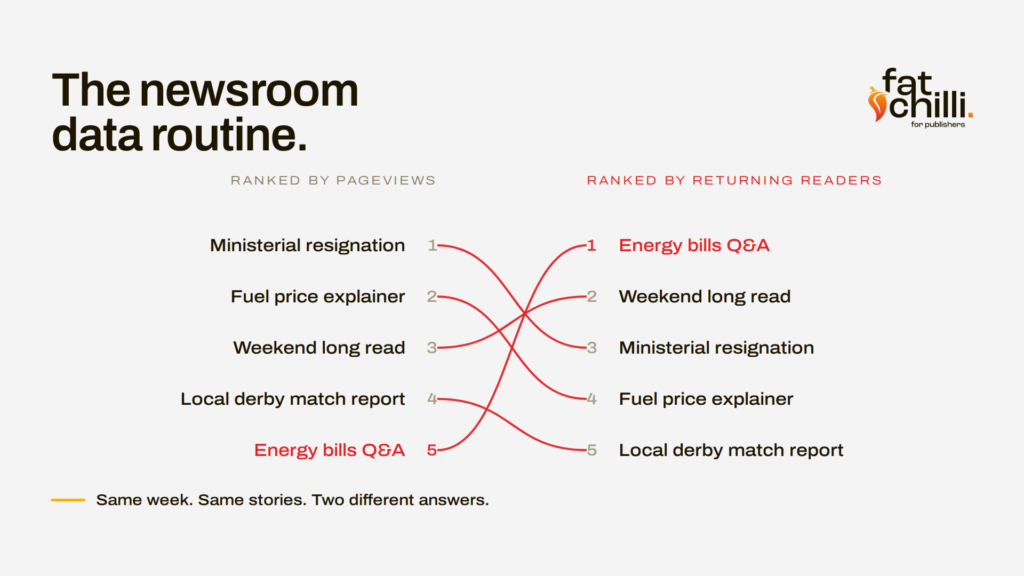
Why: returning visitors build audience value over time. The standard acquisition view, ranked by raw clicks, often shows a different top three than the same view filtered for readers who returned. The second ranking is the one to use when deciding where to spend acquisition effort.
…
Monthly (1 hour)
What share of last month’s new registrants is still active 30 days later, broken down by acquisition source?
Why: a channel that signs people up cheaply but loses 90% of them in 30 days has a true acquisition cost roughly ten times its headline number. The 30-day curve by source is what makes a channel comparison meaningful; without it, the cheapest channel often looks best when it’s actually the worst.
[ Download ‘The newsroom data routine’ checklist ]
(PDF, 8 pages, free)
The part nobody wants to hear
We run a version of this exercise with publishers regularly, and the result is the same nearly every time.
The daily questions get answered. Somebody opens the dashboard before the morning meeting, looks at yesterday, and the routine holds because it has an obvious owner and an obvious moment in the day.
The monthly questions get answered by nobody.
Not because they are harder. Because they have no owner and no slot.
The numbers that decide where next year’s money goes are the numbers nobody is looking at.
Three things deliberately left off this list
Maybe surprisingly for some, total pageviews and unique visitors, bounce rate, and time on page are left out of the checklist. Why?
While total pageviews and unique visitors are meaningful metrics for the sales team, for editorial, it creates an average reader and hide the details that are important for further inspection.
Bounce rate comes out of e-commerce funnels, and it usually speaks to Core Web Vitals and is a signal for your IT team rather than your editorial.
Time on page measures how long a browser tab was open. Instead, metrics like quality reads or scroll depth give you a better understanding of engagement with each story.
Enjoyed the post? Share it.

FatChilli helps publishers turn audiences into revenue.














FatChilli's Solutions